Скока у вас стоит?Допис від Zebr

| Gorod.dp.ua » Міські форуми / Городские форумы |
|
|


Скока у вас стоит?
\nabla \cdot \mathbf {B} =0

Как я ездил - 55-60.


давно выдавило? че с суточным расходом?
Ахз, не написано когда выдавило.
Эта тема с расходом выглядит скорее как анекдот
ну я ради интереса начал посматривать на суточный расход. Разбег от 7.6 до 13. Это все в пределах моих обычных поездок по Сплиту. Какие либо выводы делать на их основе у меня не получается
Все короткие поездки. Какие из этого можно выводы сделать - не знаю.
я могу сделать выводы - ты задрот с Графаной ))
Согласись, по сравнению с блокнотиком - левел ап
не думал скормить АИ и спросить - А чтобы бы это значило? ))
Прикинь он скажет тебе нужно проверить заднюю подвеску ))))
Это как огород спрашивать: буков много, пользы - нет
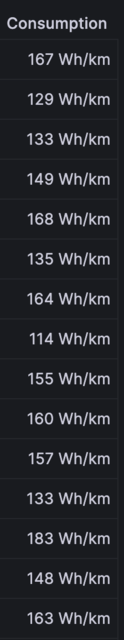
The data points in the screenshot show a range of consumption values for your car's electricity usage, measured in watt-hours per kilometer (Wh/km). Here are a few conclusions that can be drawn from this information:
Variability: The consumption values vary, which could indicate different driving conditions or behaviors. The lowest recorded consumption is 114 Wh/km, and the highest is 183 Wh/km. This suggests that there are times when the car is more energy-efficient and others when it uses more energy per kilometer.
Efficiency Range: The car's efficiency isn't constant and seems to fluctuate significantly. This range can be influenced by several factors, such as driving style (e.g., aggressive acceleration, speed), road conditions (e.g., city traffic, highways), and environmental conditions (e.g., weather, terrain).
Potential for Optimization: Identifying the conditions under which the lower consumption values were recorded could help you optimize the car's energy usage. For example, if the lower values correspond with highway driving, it might suggest that the car is more efficient at steady speeds rather than stop-and-go traffic.
Battery Health: If these readings were taken over a long period, a gradual increase in consumption could indicate battery health degradation. Batteries tend to become less efficient over time, leading to higher energy consumption.
Benchmarking: You could use this data to benchmark your car's energy consumption against the manufacturer's specifications or against other similar vehicles to assess its performance.
To delve deeper into this data, it would be useful to have additional context such as the time over which this data was collected, any changes to the car or driving habits, and external conditions during each data point.
отличный текст для презентации почему каждому теславоду нужна графана ))
А ты попробуй сравнивать по одним и тем же маршрутам.
Но я тебе завидую, у тебя так много разных точек на карте города, прям разнообразие каждый день. Жена знает о них?
Ого, огрызается
а мне эти маршруты куда записывать и расходы, в блокнотик или в голове хранить?
Палятся всегда на мелочах, так что думай
\nabla \cdot \mathbf {B} =0
так где ты хранишь информацию о поездках? ) Сколько последних расходов для одного маршрута знаешь, чтобы понимать есть отклонение или нет?
Сложно, очень сложно
\nabla \cdot \mathbf {B} =0
должно быть проще, чем с лисапедом ))
С лисапетом там вообше все хорошо, сходил на на службу в церковь и вспомнил где забыл
\nabla \cdot \mathbf {B} =0

А так смогешь,

 Ваші права у розділі

| Головна | Афіша | Новини | Куди піти | Про місто | Фото | Довідник | Оголошення | |
| Контакти : Угода з користивачем : Політика конфіденційності : Додати інформацію |
copyright © gorod.dp.ua. Всі права захищені. Використання матеріалів сайту можливо тільки з дозволу власника. Про проєкт :: Реклама на сайті |

|

 Відповісти з цитуванням
Bookmarks